So you’re a beginning developer or just someone who needs to make a quick change to the styling of your site. You know the CSS that you need to change, but you don’t know what exact element to call. How do you find that information?
It’s simple. The inspector tools.
These set of tools, which are included now in all major modern browsers, give you the keys to find out what’s going on with the page in the HTML, CSS, JavaScript and more. And they’re incredibly powerful.
What are the inspector tools?
So if you don’t know, the inspector tools are. It started out with Firebug back in 2005 which added the ability for developers to check out the document object model, see the CSS styling for specific elements and check out the console for JavaScript output.
Today, this tool is common place in every major modern browser. It’s a must-use tool for any web developer. The amount of information
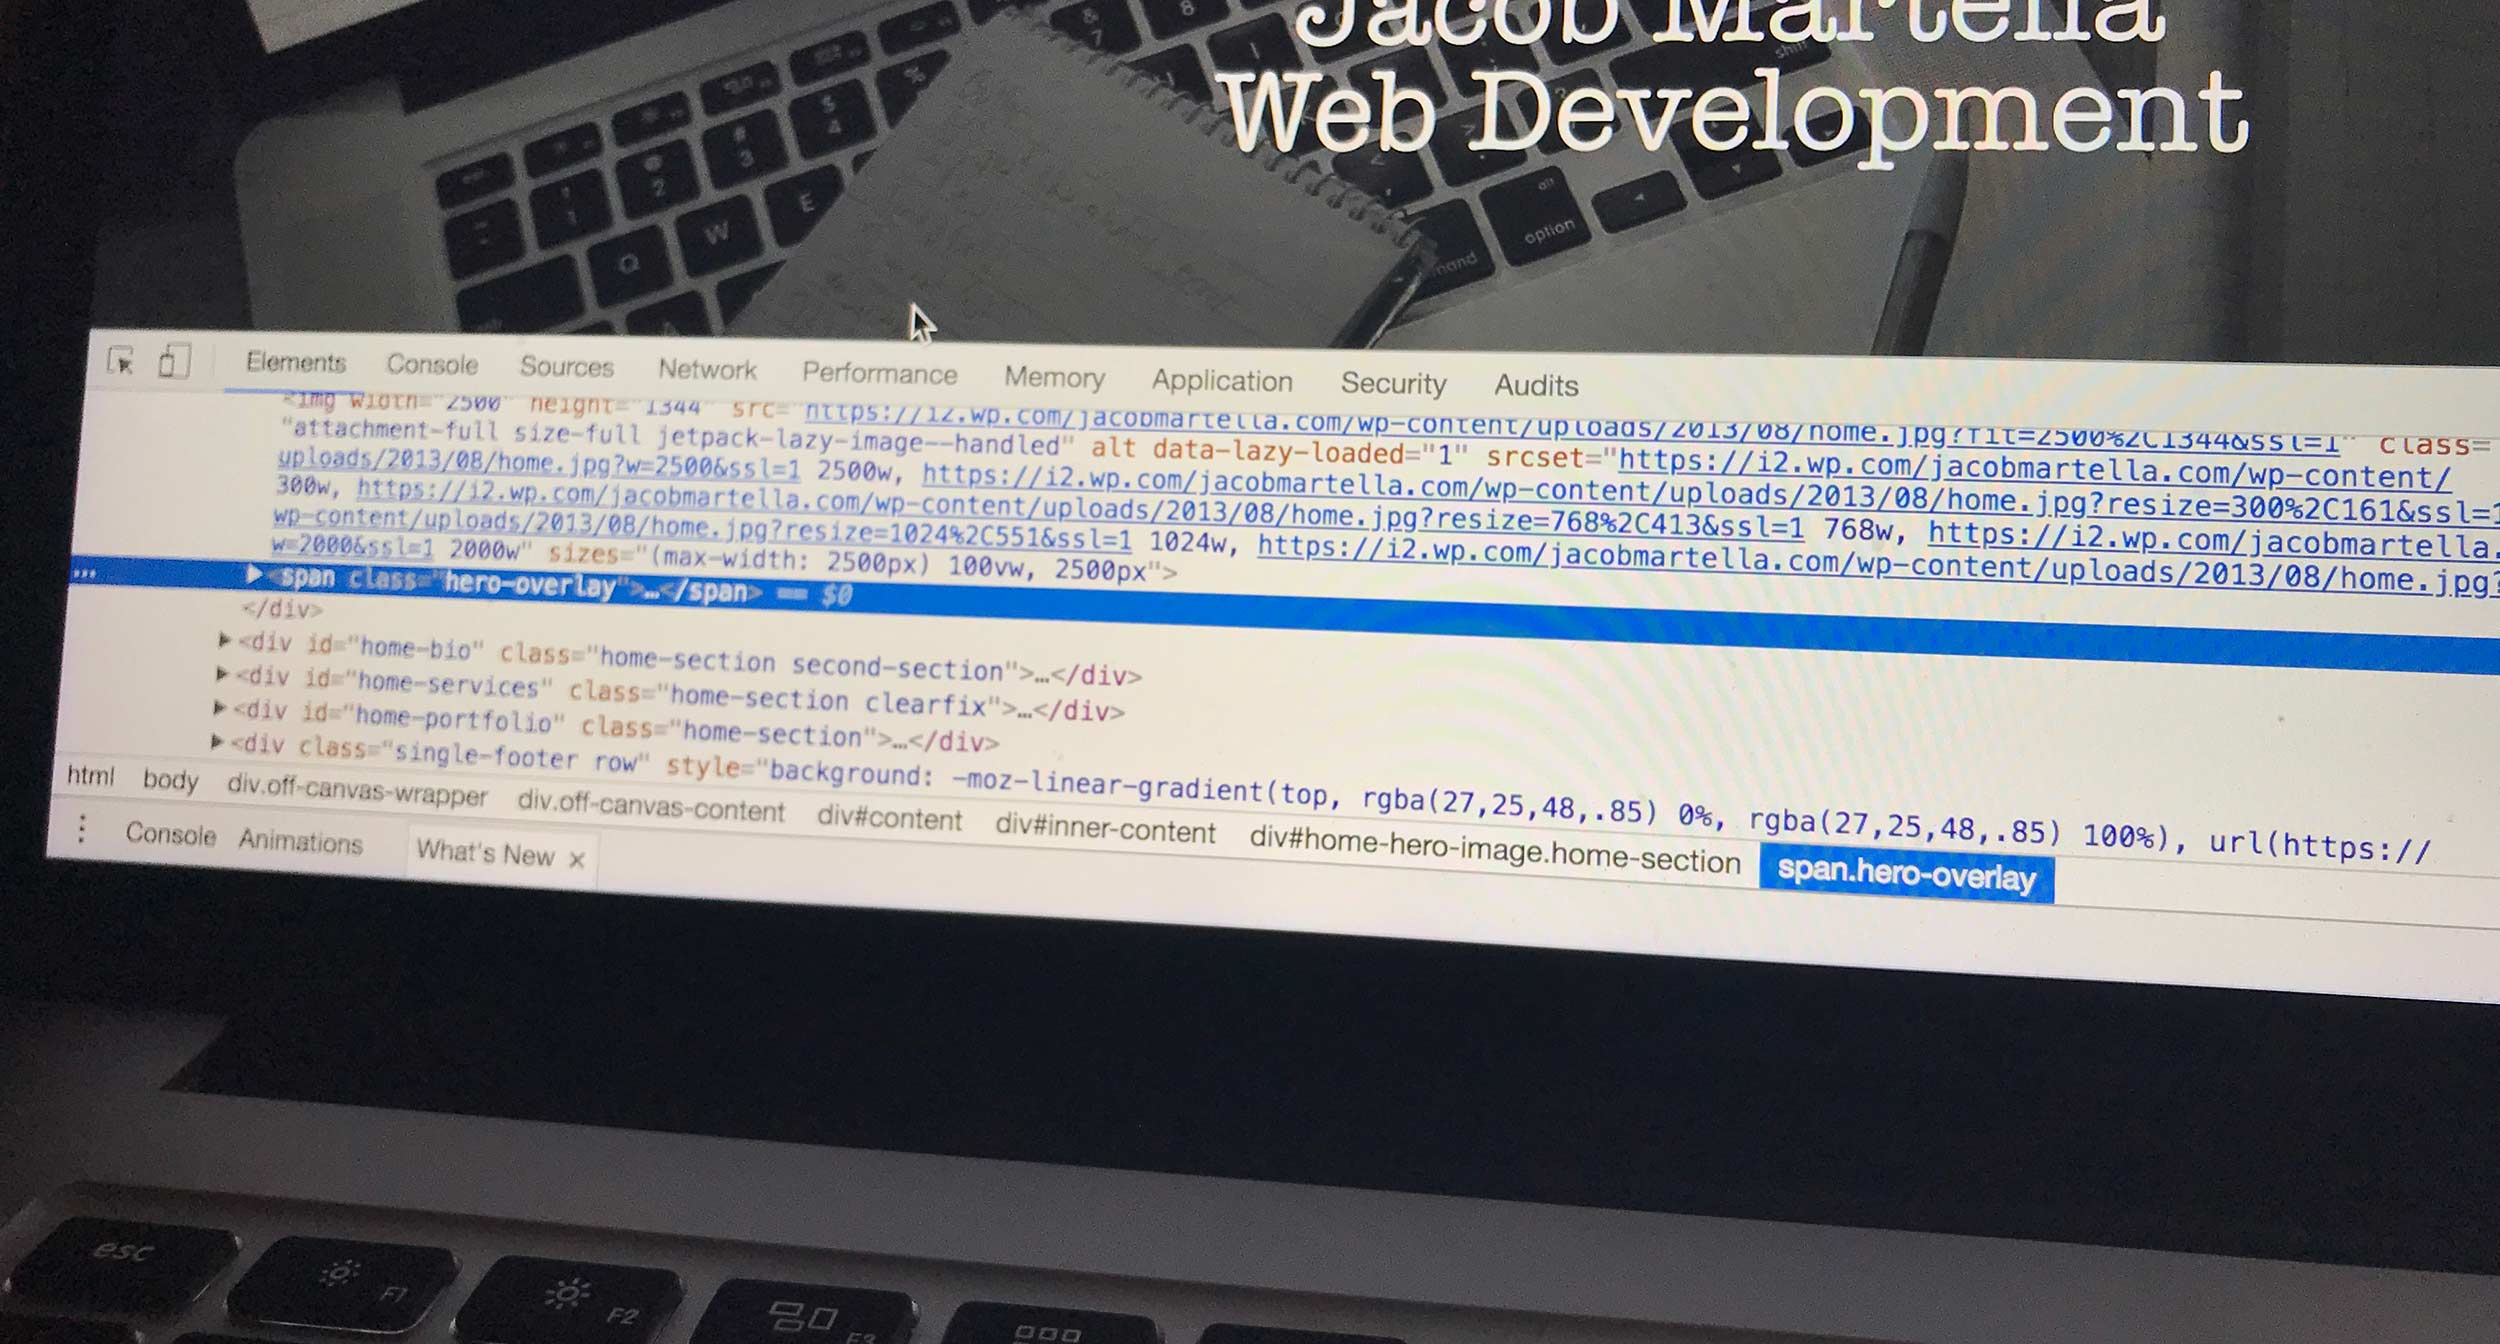
When you first open up the inspector (it’s different for every browser, see more in the next section), you’ll usually come across a panel with the HTML on the left, and CSS information for a selected element. This is great for figuring out what CSS selectors you need to make a quick change.
But the most powerful part is being able to change the CSS on the fly. You can move elements around, and change any attribute you want. You can’t really save those CSS changes (although in Chrome’s inspector you can). Nor would you really want to. Instead, it help you get an idea of what you need to do in your CSS to get the styling correct.
You can also use the console to output test JavaScript output to debug a program and to run JavaScript on the fly to test somethings out. And there are other tools such as a panel telling you of all the resources used on the page (and if you’re getting any errors) and one telling you the performance of the page.
How do you find the inspector tools?
Finding the inspector tools is pretty simple. On any webpage, right click on the page and look for “Inspect” or something similar. The exact wording to take you to the tools varies from browser to browser.
Typically, when you go this route and open the inspector, it will open with the “Elements” tab open, a breakdown of the HTML of the page and the styling for the div you right clicked on. But from here, you can navigate to the console, check the sources and do everything else in the inspector.
You can also pull up the inspector in Chrome through the toolbar by going to View -> Developer -> Developer Tools. A similar process will get you to the inspector tools through the toolbar on other browsers, though again it varies between browsers.
Using the inspector tools on mobile
One aspect that tends to get looked over is the ability to use the inspector tools on your mobile phone. Specifically, if you have an iPhone or iPad and have Safari on your Mac.
To achieve this, simply connect your phone to your computer with the lightning cable. Next, on your phone, go to Settings -> Safari -> Advanced and turn on the web inspector. On your desktop, make sure you can see “Develop” in the toolbar. Otherwise, go to Safari -> Preferences -> Advanced and select “Show develop menu in menu bar”.
Then open Safari in both the phone and the desktop. Next go “Develop” and hover your phone’s name. Make sure your phone is on an actual webpage, and URL for the site should appear. Finally, click on that URL and the inspector window should appear.
I’ll be honest, I’m not entirely sure if this is applicable for other devices and browsers, but a quick Google search should help you out.
But, I hope you’re now able to use the inspector tools. They really are a powerful thing once you get used to working with them and learning how to best use them. And whether you’re a web developer or someone just trying to make a quick CSS change, it’s going to be quite handy.


